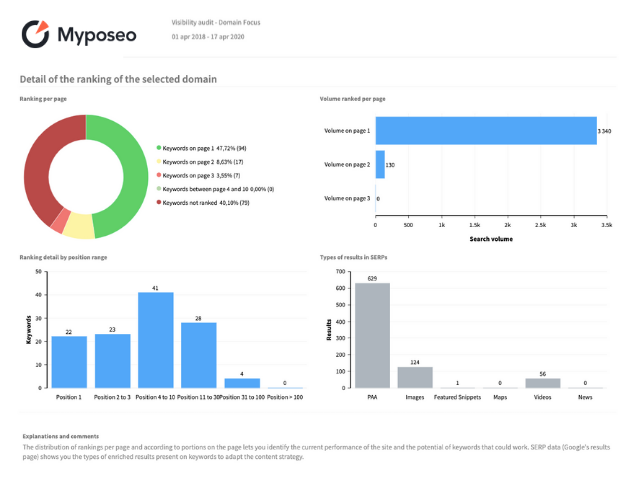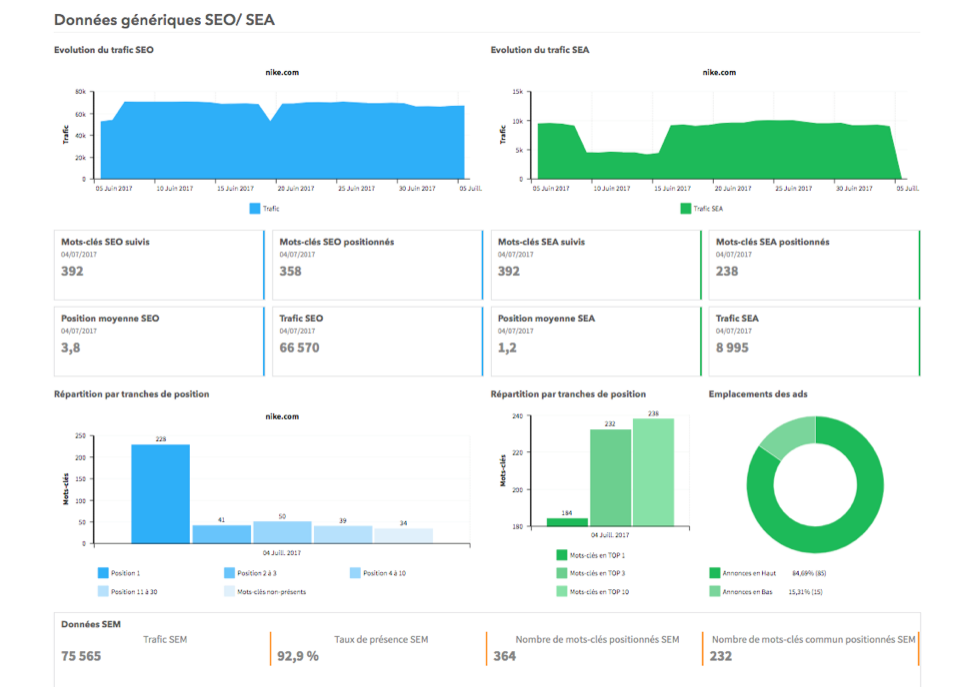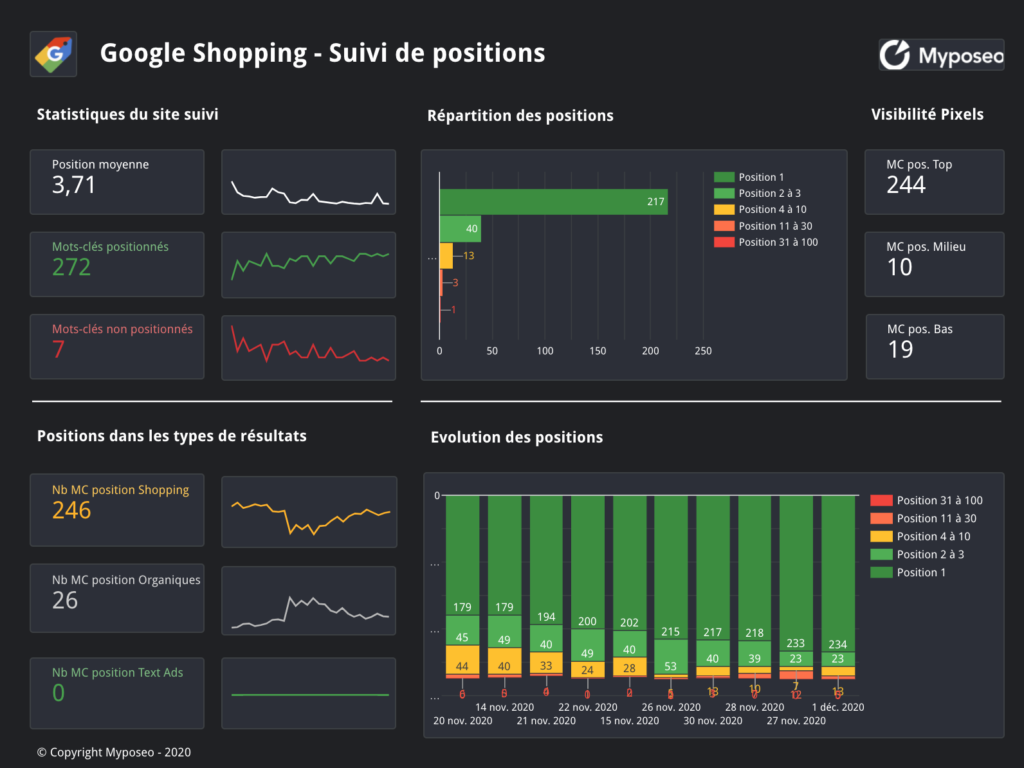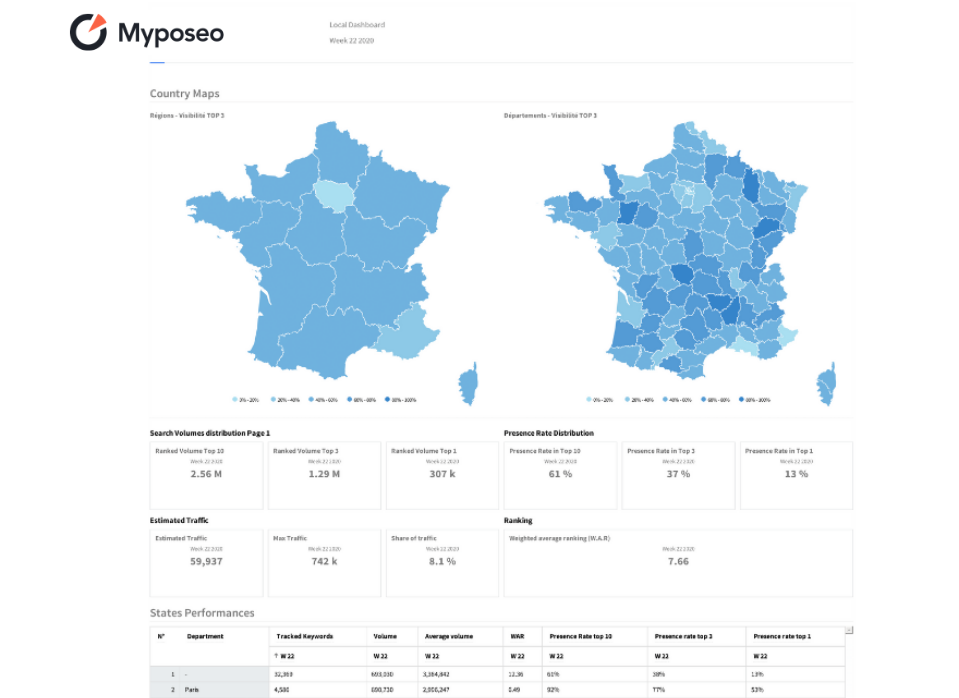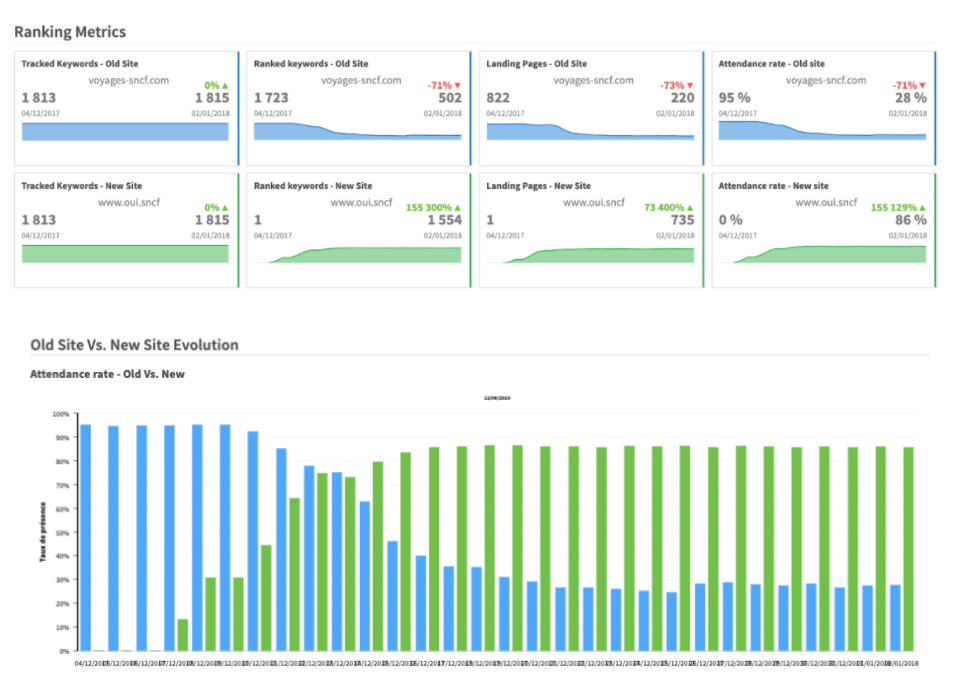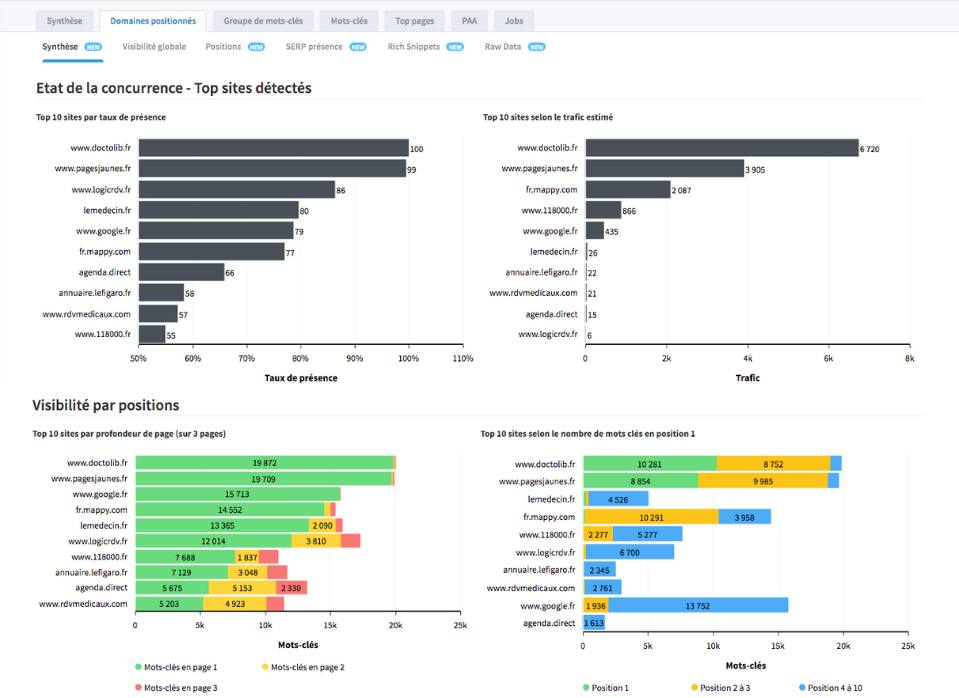


Myposeo collecte plus de 600 indicateurs pour vos campagnes SEO et Ads. Nous regroupons dans Myposeo les indicateurs de performance et de visibilité des sites web, et assurons la sauvegarde de votre historique de présence en référencement dans les moteurs de recherche.
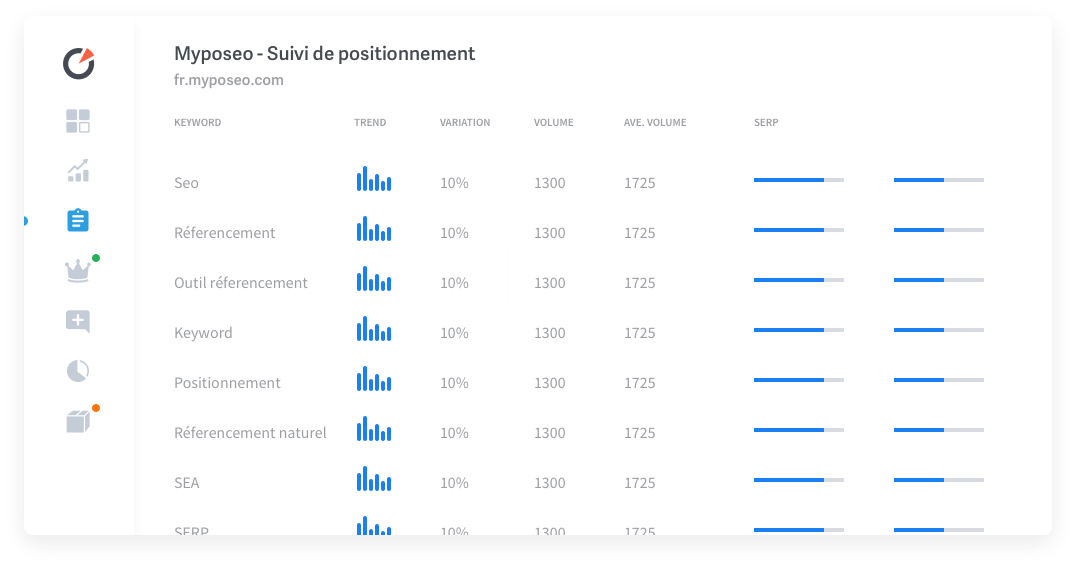
Surveillez et gérez vos campagnes SEO et SEA, ainsi que le positionnement de vos mots-clés grâce à nos systèmes de suivi quotidien. Accédez à une synthèse de vos campagnes pour en évaluer l'efficacité.
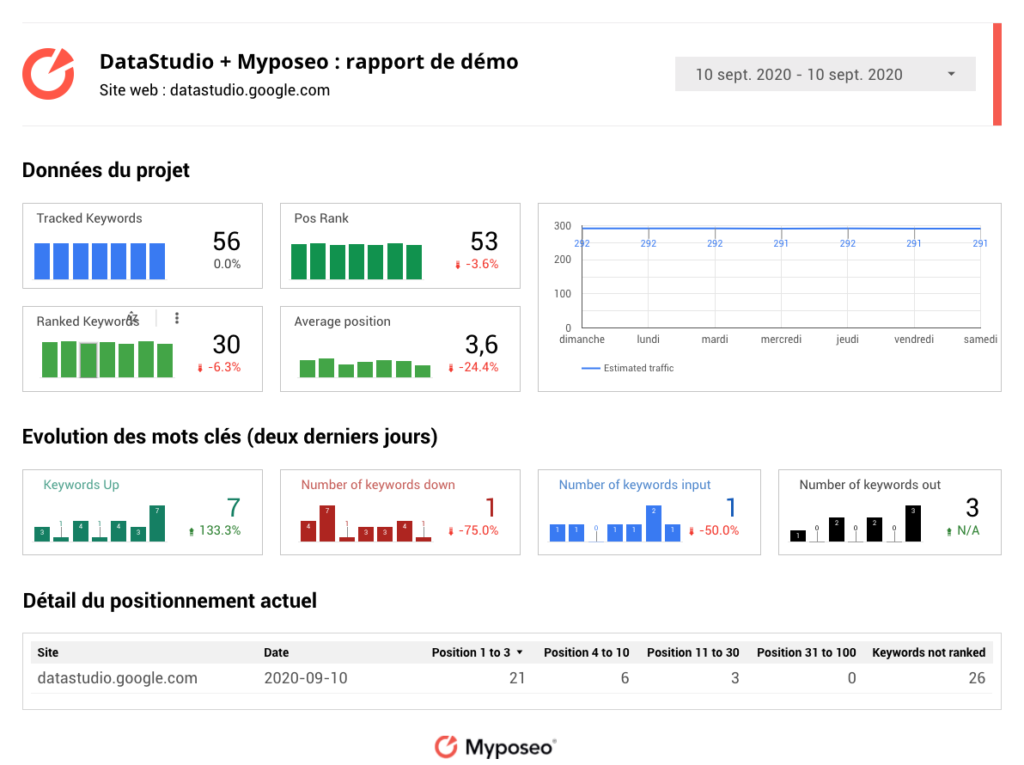
Nos rapports SEO intelligents s’adaptent à tous formats (PDF, CSV, json, email) et à tous les interlocuteurs de l’entreprise : du Responsable SEO Technique au Directeur Marketing et Communication.
Grâce à l'automatisation de la collecte de données, du rendu et du partage de vos rapports, vous consacrerez votre temps à optimiser vos campagnes de référencement naturel.